280 : Basis-Plotter
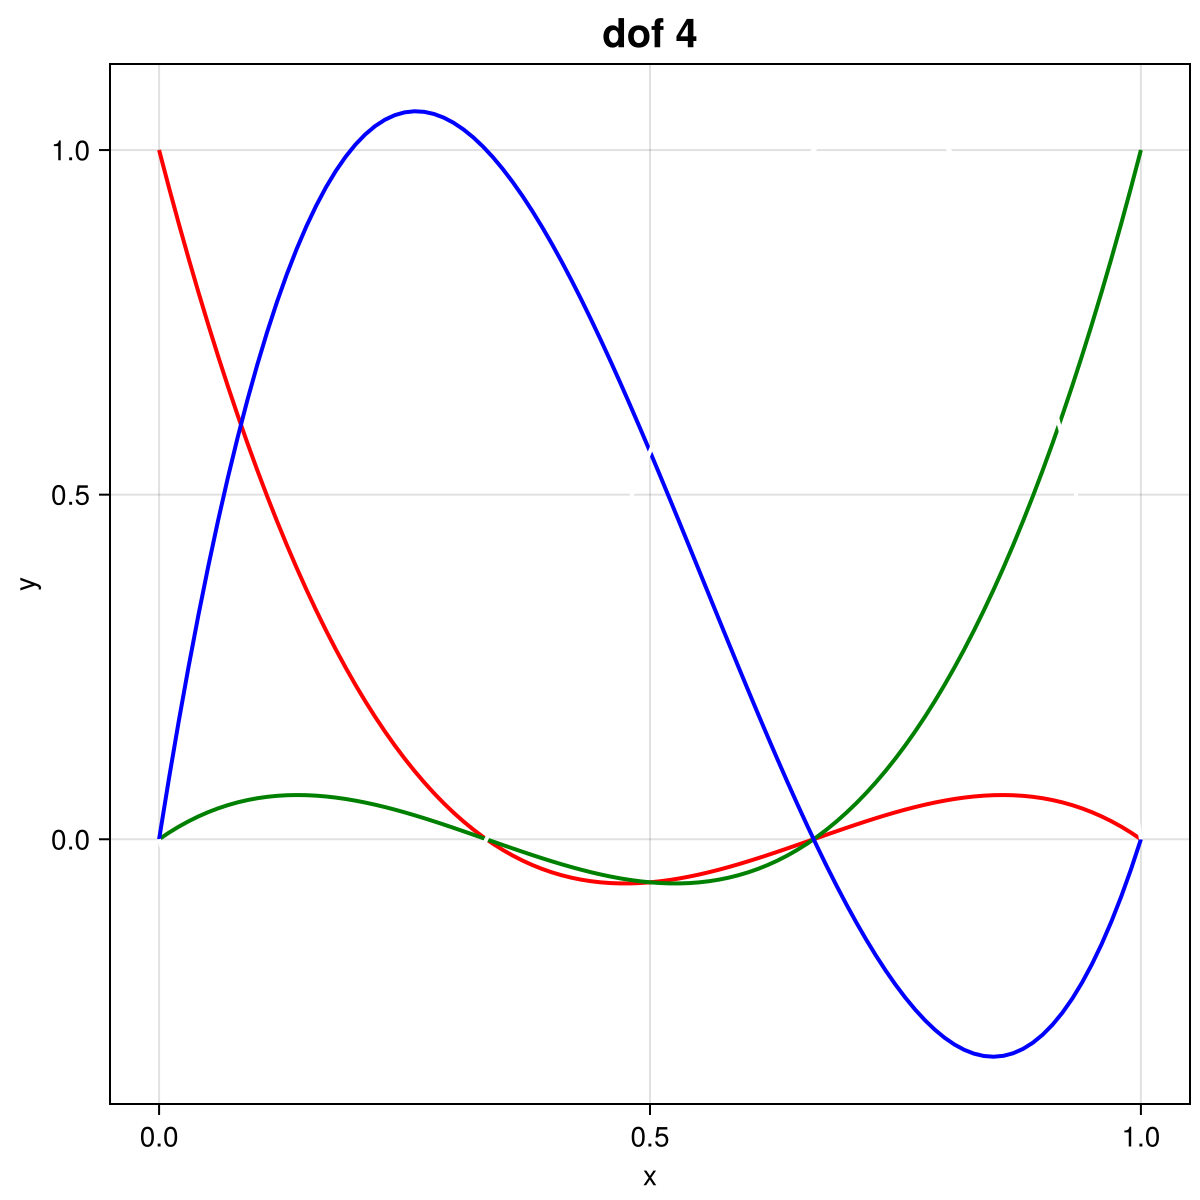
This example plots all the basis functions of a H1 finite element on Edge1D or Triangle2D as unicode plots. This is the result with the default parameters (dim = 1, order = 3):
module Example280_BasisPlotter

using ExtendableFEMBase
using ExtendableGrids
using GridVisualize
using UnicodePlots, Term

# everything is wrapped in a main function
function main(; dim = 1, order = 3, Plotter = UnicodePlots)

    # generate two grids
    @assert dim in [1, 2] "dim must be 1 or 2"
    @assert order in 1:4 "order must be between 1 and 4"
    refgeom = dim == 1 ? Edge1D : Triangle2D
    xgrid = reference_domain(refgeom)

    # set finite element type and get some information
    FEType = H1Pk{1, dim, order}
    ndofs = get_ndofs(ON_CELLS, FEType, refgeom)
    FEType = H1Pk{ndofs, dim, order}

    # generate FEVector with ncomponents = ndofs
    # that will carry one basis function in each component
    FEFunc = FEVector(FESpace{FEType}(xgrid))
    coffsets = ExtendableFEMBase.get_local_coffsets(FEType, ON_CELLS, refgeom)
    for j in 1:ndofs
        FEFunc[1][j + coffsets[j]] = 1
    end

    # interpolate on finer grid
    xgrid_plot = dim == 1 ? simplexgrid(0:0.01:1) : uniform_refine(xgrid, 4)
    I = FEVector(FESpace{H1P1{ndofs}}(xgrid_plot))
    lazy_interpolate!(I[1], FEFunc, [(1, Identity)])

    # plot
    if dim == 1
        layout = (1, 1) # everything is plotted into one plot
        size = (600, 600)
        colors = [:red, :green, :blue, :white, :yellow, :cyan, :magenta]
    elseif dim == 2
        l = round(Int, ceil(sqrt(ndofs)))
        if l^2 - l >= ndofs
            layout = (l - 1, l)
        else
            layout = (l, l)
        end
        size = (1000, 1000)
        p = permutedims(reshape(1:prod(layout), layout))[:]
    end
    plt = GridVisualizer(; Plotter = Plotter, layout = layout, size = size)
    for j in 1:ndofs
        if dim == 1
            ExtendableFEMBase.scalarplot!(plt[1], I[1], IdentityComponent{j}; Plotter = Plotter, clear = false, title = "dof $j", color = dim == 1 ? colors[j] : :white)
        else
            ExtendableFEMBase.scalarplot!(plt[p[j]], I[1], IdentityComponent{j}; Plotter = Plotter, clear = false, title = "dof $j", color = dim == 1 ? colors[j] : :white)
        end
    end
    reveal(plt)
    return FEFunc, plt
end

function generateplots(dir = pwd(); Plotter = nothing, kwargs...)
    ~, plt = main(; Plotter = Plotter, kwargs...)
    scene = GridVisualize.reveal(plt)
    return GridVisualize.save(joinpath(dir, "example280.png"), scene; Plotter = Plotter)
end
end
This page was generated using Literate.jl.