1D Grid examples
using ExtendableGridsInterval from vector
function interval_from_vector() X = collect(0:0.05:1) return simplexgrid(X)end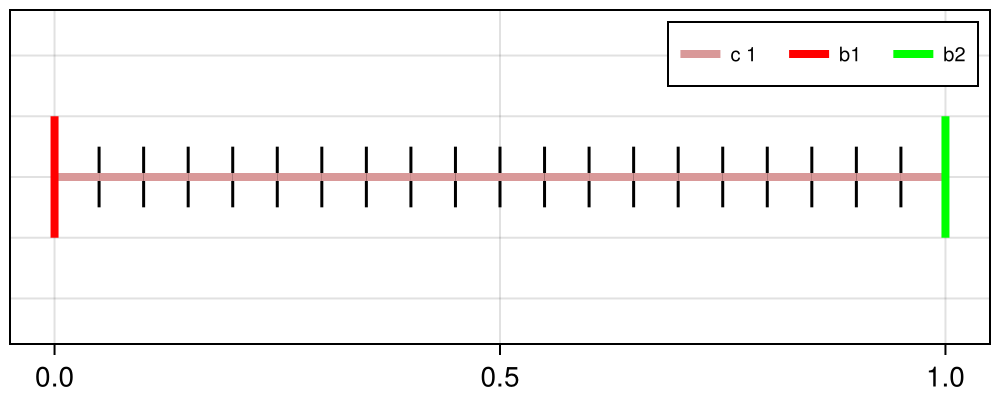
Interval with local refinement
function interval_localref() XLeft = geomspace(0.0, 0.5, 0.1, 0.01) XRight = geomspace(0.5, 1.0, 0.01, 0.1) X = glue(XLeft, XRight) return simplexgrid(X)end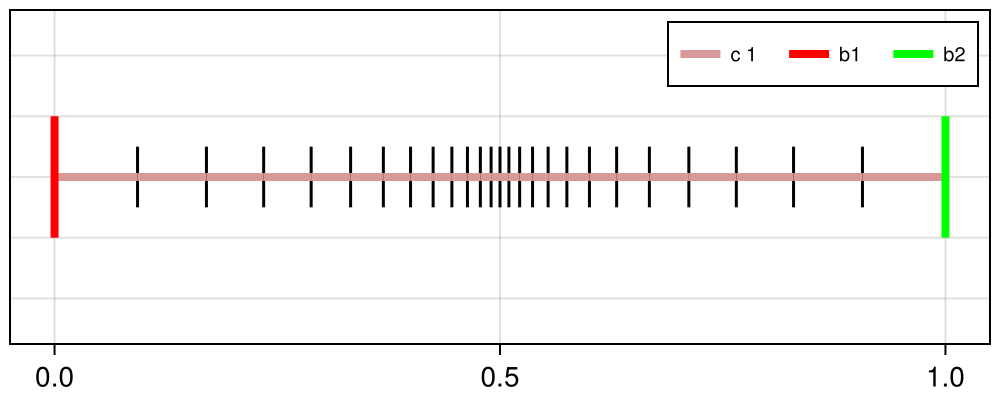
Interval with multiple regions
function interval_multiregion() X = collect(0:0.05:1) grid = simplexgrid(X) cellmask!(grid, [0.0], [0.5], 3) bfacemask!(grid, [0.5], [0.5], 4) return gridend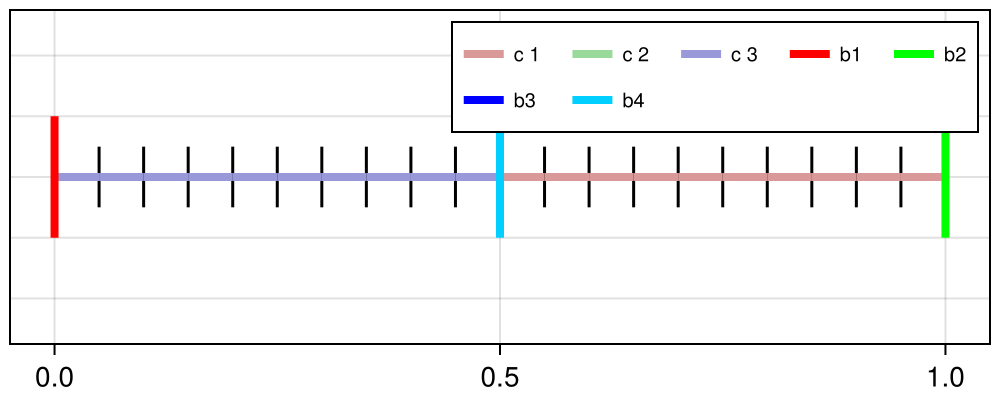
Multiple regions and subgrid
function interval_subgrid() X = collect(0:0.01:1) grid = simplexgrid(X) bfacemask!(grid, [0.5], [0.5], 3) cellmask!(grid, [0.0], [0.25], 2) cellmask!(grid, [0.2], [0.5], 3) return subgrid(grid, [2, 3])end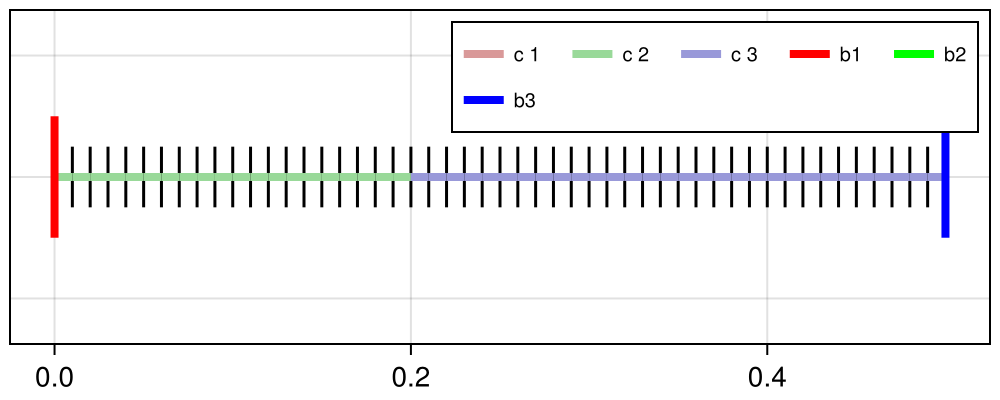
CI callbacks for ExampleJuggler.jl
Unit tests
using Testfunction runtests() @test isconsistent(interval_from_vector()) @test isconsistent(interval_localref()) @test isconsistent(interval_multiregion()) @test isconsistent(interval_subgrid()) @test numbers_match(interval_from_vector(), 21, 20, 2) @test numbers_match(interval_localref(), 27, 26, 2) @test numbers_match(interval_multiregion(), 21, 20, 3) @test numbers_match(interval_subgrid(), 51, 50, 2) return nothingendPlot generation
using GridVisualizefunction generateplots(picdir; Plotter = nothing) if isdefined(Plotter, :Makie) size = (500, 200) legend = :rt Plotter.save(joinpath(picdir, "interval_from_vector.png"), gridplot(interval_from_vector(); Plotter, size, legend)) Plotter.save(joinpath(picdir, "interval_localref.png"), gridplot(interval_localref(); Plotter, size, legend)) Plotter.save(joinpath(picdir, "interval_multiregion.png"), gridplot(interval_multiregion(); Plotter, size, legend)) Plotter.save(joinpath(picdir, "interval_subgrid.png"), gridplot(interval_subgrid(); Plotter, size, legend)) end return nothingendThis page was generated using Literate.jl.